Analysis of the offensive and defensive ranks for Super Bowl champions
by Jason Pauley
“Defense wins championships!” — early to mid-2000s
“Offense wins championships!” — today
“Neither wins championships!” — ’07 and ’11 Giants
This analysis shows the regular season rank (PPG) of every Super Bowl winner since the merger. My goal was to see if there were any trends in SB winners being ranked higher on defense or offense. There are some notable time periods where you can see trends in teams winning with defenses carrying the team, as well as eras (like now) where more teams who excel at offense are winning.
TL;DR scroll down to the chart and explore the data and trends.
This is simply a look back to find historical trends, outliers, and interesting patterns. The intent is not to be predictive in any way or to make any bold claims on how teams should be built. When exploring the data, which you will see on the chart, these are a few distinct eras that seemed to separate themselves for various reasons:
2017-present, an era of offense
We are currently in an era where offense wins championships. All six of the last six Super Bowl champions had an offense ranked higher than defense, and that gap between rankings has increased in each of the last three years with the 2020 Buccaneers (offense +5 over defense), 2021 Rams (+8) and culminating with the 2022 Chiefs who were ranked #1 on offense and # 16 on defense. The average offense is ranked almost 6 spots higher than the average defense for a Super Bowl winner since 2017 (Offense 3.8, Defense 9.5). Five of the six last winners had a top 5 offense (2017 Eagles 3rd, 2018 Patriots 4th, 2019 Chiefs 5th, 2020 Bucs 3rd, and the 2022 Chiefs 1st). The only team not in the top five were the 2021 Rams, but their offense (7th) was still ranked 8 spots ahead of their defense.
2000–2005, and era of defense
From 2000–2005 you might have been able to suggest “Defense wins championships”. The average Super Bowl winner had a defense ranked 8 spots better than the avg offense (Defense 2.3, Offense 10.5). During this period, three of the six winners were ranked #1 on defense (2000 Ravens, 2002 Bucs, and 2003 Patriots). The other Super Bowl champions were also ranked high on defense (2004 Patriots #2, 2005 Steelers #3 and the 2001 Patriots #6). This era could be an era of defense, or it might just be that it’s heavily influenced by one team, the Patriots who won 50% of the Super Bowls during this time with a highly ranked defense.
2006–2015 the golden era of mediocrity
During this time, the average Super Bowl winner ranked only 10.5 in the league for PPG scored and allowed. Part three of the chart (green bars) illustrates this where the bars spike showing the average offense and defense ranking getting worse. The team that exemplifies this era the best is the 2007 and 2011 Giants who own the two worst combined rankings for a SB champion. In 2007 they averaged a ranking of 15.5, and in 2011 they averaged 17.0.
In the 53 years since the merger, there have been only eight Super Bowl winners to be ranked an average of 10th or worse for offense and defense combined, seven of them came during this 10-year era of mediocrity, and only one occurred during the other 43 years. The ’06 Colts (avg rank of 12.5), the ’07 and ’11 Giants mentioned above, ’08 Steelers (10.5), ’09 Saints (10.5), ’12 Ravens (11.0) and the ’15 Broncos (11.5) were all Super Bowl champions during seasons with relatively poor PPG rankings during the regular season.
2000-present, and era of imbalance
We are also in an era of extremes. From 2000 to 2022, the absolute value of the gap between the Super Bowl champions’ offensive rank and defensive rank is almost 9 positions. This is more than twice as large as the gap between rankings from 1970 to 1999 when the gap was only 4. You can see the stark difference between pre-2000 and post-2000 in the 2nd section of the chart. The 2006 Colts exemplify this trend with the 2nd ranked offense and 23rd ranked defense. The 2008 Steelers were extreme the other way with the #1 ranked defense and 20th ranked offense. All in all, there are 12 Super Bowl champions out of the 23 since 2000 that had ranking gaps between offense and defense of 7 positions or greater. This happened only four times in the 30 years leasing up to 2000.
1970–1999, an era of dominance
Until about 1999, the Super Bowl winner was more likely to have a better avg PPG ranking for offense and defense than post-1999. 23 of 30 SB winners from 1970–99 averaged a top 5 rank. For those 30 years, the avg SB winner was ranked 4.2, compared to teams being ranked 8.1 since 2000. Fewer teams during this era is a factor unrelated to the quality of the Super Bowl champion. Fewer teams increase their ability to be ranked better. But a bigger factor is probably less parity. The salary cap was implemented in 1994. Prior to 1994 dynasties and dominance were more likely. (Note-this makes the Patriots dynasty all the more impressive, as it was during a period designed for parity).
During this period there were two Super bowl winners ranked #1 on both offense and defense, the 1972 Dolphins and the 1996 Packers. The 1984 49ers and 1985 Bears were both ranked #2 on offense and #1 on defense. The 1991 Redskins were #1 on defense and #2 on offense. The 70’s Steelers teams with four Super Bowl wins averaged the 4th best offense and a defense ranked 2.5. The 90’s Cowboys averaged a rank of 2.3 on offense and 3.3 on defense over their three championship seasons. The 49ers won five Super bowls over the course of 14 years, averaging an offensive rank of 3.6 and a defensive rank of 4.0. The era of dominance ended after the Greatest Show on Turf, the 1999 Rams ranked 1st overall on offense and 4th on defense.
The Chart:
It’s a busy chart, but I wanted everything in one place so you can follow the SB champions throughout the three sections which all show different slices of the same data. There is a table at the end if you prefer that over the graph.
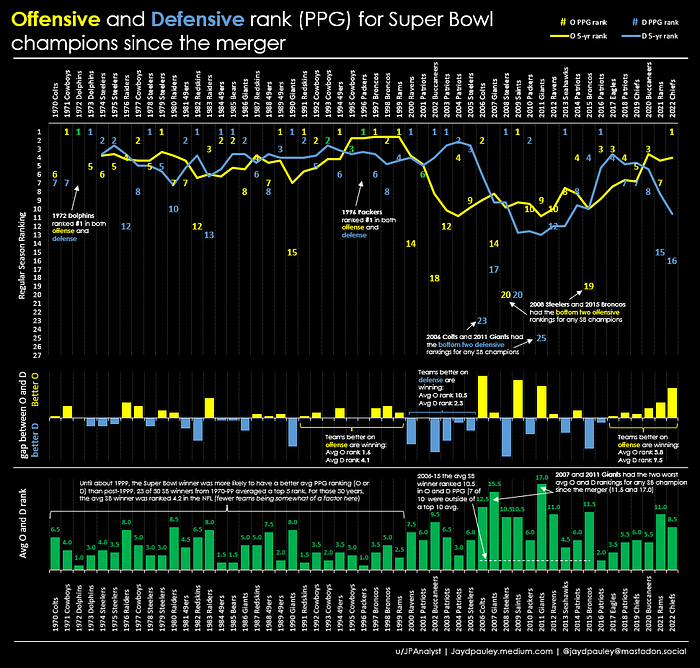
Top Section
This shows the offensive PPG and defensive PPG rank for each super bowl champion. The Y-axis is the rank (best rank #1 at the top, worst at the bottom). The team’s offensive rank is in yellow, defensive rank in blue. Green is used when they have the same rank for offense and defense.
The line is a rolling 5-year average to illustrate ay long terms trends that might have occurred. Using this year’s Chiefs as an example: They were ranked #1 in the NFL for PPG (the yellow “1”), and on defense they were ranked 16th (blue “16”). You can see the rolling 5-year average for offense improves a bit as the 2017 Eagles and their 3rd ranked offense drops off while the #1 Chiefs gets added. The rolling 5-year defensive trend continues to slide because of the 8th ranked defense three years ago (Bucs), the 2021 winners (Rams) with a 15th ranked defense, and now the Chiefs with their 16th ranked defense.
Middle Section
This shows the gap between a team’s offensive rank and their defensive rank, to understand if teams were better on offense or defense relative to each other. A yellow bar means they were better on offense than defense, a blue bar means they were better on defense. The longer the bar, the bigger the gap. The Chiefs were ranked #1 on offense and #16 on defense, a gap of 15 which you can see is the 4th largest offense over defense gap for a Super Bowl champion.
Bottom Section
This is the average ranking of both offense and defense combined. The 2022 Chiefs average rank is 8.5 (offense 1, defense 16)
Some other highlights from the data:
- The other “Offense wins championships” period was 1991–1999. The 90’s (after the 1990 Giants) was a time period where some of the best regular season teams were winning the Super Bowl, which is not always the case. From 1991–99 the average Super Bowl winner won almost 13 games, and their average offense and defense rank was 2.8. Their offenses were ranked 1.5 and their defenses were ranked 4.1. There were five #1 ranked offenses out of the nine SB winners (1991 Washington, 1994 49ers, 1996 Packers, 1997 Broncos, and 1999 Rams). The 1992, 1993 and 1995 Cowboys as well as the 1998 Brocos all had offenses in the top three. No offense was ranked worse than 3rd overall in the NFL during this era.
- The 5 worst defenses to win a Super Bowl were: 2011 Giants 25th, 2006 Colts 23rd, 2009 Saints 20th, 2007 Giants 17th, and this year’s Chiefs with a rank of 16 were the 5th worst defense to win a Super Bowl.
- The 5 worst offenses to win a Super bowl were: 2008 Steelers 20th, 2015 Broncos 19th, 2002 Buccaneers 18th, 1990 Giants 15th, 2000 Ravens and 2007 Giants were tied for 5th worst at 14th.
- #1 ranked: Out of 53 Super Bowl winners since the merger, 23 (43%) were ranked #1 in either offense or defense. 11 were ranked #1 on offense. 13 were ranked #1 on defense. Two were ranked #1 in both.
- Top five: Out of 53 Super Bowl winners since the merger, 45 (85%) were ranked top five in either offense or defense. 32 were ranked top five on offense. 30 were ranked top five on defense. 17 were ranked top five in both. The 2017 Eagles were the last Super Bowl winner to be ranked top 5 in offense (3rd) and defense (4th)
- Overall, since the merger, the average Super Bowl winner is ranked 5.7th on offense and 6.0 on defense.
Same data but table format