The Super Bowl Hangover: Fact or Fiction?
A data-driven look at the success of teams the season after playing in the Super Bowl
by Jason Pauley
I have long believed the theory that there is a Super Bowl hangover, or as some call it, a Super Bowl curse. How else can it be explained that so many Super Bowl losing teams didn’t make it back to the playoffs the next year? I will list a few examples. The 2016 Carolina Panthers missed the playoffs a year after going 15–1 and losing to the Denver Broncos in the Super Bowl. The Chicago Bears went 13–3 in 2006, lost to the Indianapolis Colts in the Super Bowl and missed the playoffs the next year. Even the 16–0 New England Patriots missed the playoffs in 2008, the year after ending up 18–1 including the playoffs, their one loss came at the hands of the New York Giants in the Super Bowl. In this article, I will take you through my analysis and thoughts behind the theory of the Super Bowl Hangover. I might even change my mind by the end.
There are many reasons why a great team can be expected to regress the next season.
- The Draft — like most other leagues, the best teams generally pick late, the worst teams generally pick early. This helps to maintain parity in the league.
- Coaching changes — Often the coordinators of Super Bowl teams become candidates for head coaching positions the next year. Losing a great coordinator can have a disruptive effect on any team.
- Longer season — Teams that go to the Super Bowl play 19–20 games. A season that is 19%-25% longer than non-playoff teams. This may be a small factor, but perhaps the additional reps/hits can have an adverse impact on players performance or health the next season.
- Luck /Anomalies— Every team that makes it to the Super Bowl will count on some luck along the way, such as calls in their favor, fumble recovery luck, good health, David Tyree, etc. Great seasons are also great because some key players perform way above their average. These factors tend to even out over time. Bad luck and poor outlier performances are also, in part, why the worst teams generally improve the next season.
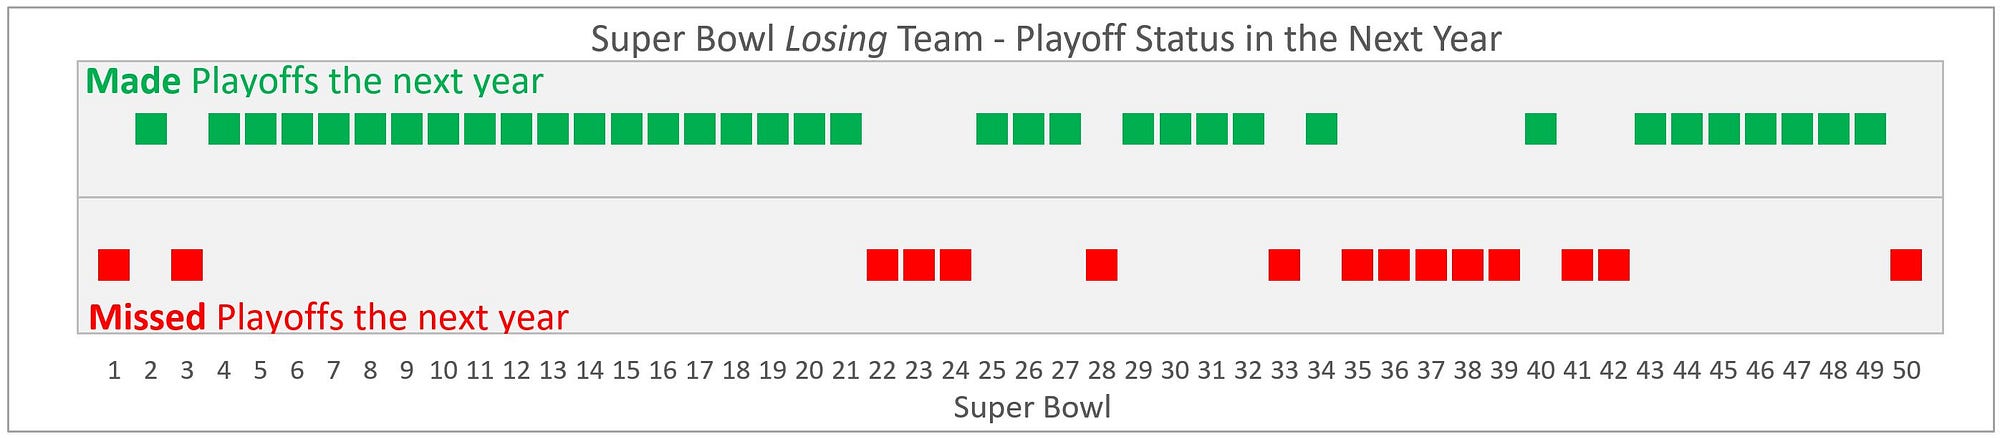
In total, 15 out of 50 Super Bowl losing teams have missed the playoffs the next year.
Maybe missing the playoffs 30% of the time doesn’t seem too bad, but these teams are arguably the best in their conference. Expecting a conference champion to simply make the playoffs the next year isn’t setting the bar too high. Data from more recent years supports the curse/hangover theory even more. 50% of all Super Bowl losing teams since the 1998 season (Super Bowl 33) have missed the playoffs the next year.
The chart below shows a timeline of each Super Bowl losing team’s playoff status the next year. The green squares above the line represent teams that went on to make the playoffs the next year. The red squares indicate teams that did not make the playoffs the year after losing the Super Bowl. For example, after getting blown out by San Francisco 55–10 in Super Bowl 24, the Denver Broncos went 5–11 the next year and missed the playoffs — this is represented by the red square.
That long run of green squares from Super Bowl 4 through 21 (1970–87) was well before the salary cap (cap introduced in 1994). The lack of a salary cap likely helped to keep the great teams competitive for long periods of time like the Redskins in the 80’s, and the Dolphins, Steelers, and Raiders in the 70’s.
While I was researching the next seasons’ performance of Super Bowl losing teams, I thought about the psychology of losing and the type of loss in the Super Bowl. How does a team respond the next season after losing on the final play or in the final minute? Does the data show any clear distinction in next season’s performance based on the type of loss a team has experienced in the Super Bowl? In the table below, I categorized the data based on the type of loss from a blowout to a heartbreaking loss. It’s important to note that the analysis is based on a total of 50 Super Bowls. Segmenting these games into four categories is going to create extremely small sample sizes. It might be hard to develop a clear and decisive finding from such small numbers. This exercise gives us a table that is probably more interesting than it is useful, but I thought it would be a fun breakdown to share. What it does tell us, if we choose to make an assumption on a small sample size, is that the type of loss really doesn't matter. Three of the four categories are very close in percent and the only category that is not around 30%, Close Game (1 Score), has a total of only seven games. One additional playoff miss would put the playoff percent in line with all of the other categories.

So, the data shows that Super Bowl losing teams miss the playoffs 30% of the time (50% more recently). That tells us something, but does it tell us enough to say that there is a Super Bowl hangover for the losing team? If there is a factor negatively impacting losing teams that isn’t impacting winning teams, maybe we will see a significant difference when we compare to Super Bowl winning teams. Maybe the losing team misses the playoffs the next year at a much higher rate than winning teams.
It turns out, Super Bowl losing teams and winning teams miss the playoffs the next year at virtually the same rate.
Below is the timeline of each Super Bowl winning teams playoff status the next year. Winning Super Bowl teams have missed the playoffs 32% of the time the next season. I mentioned earlier, that since 1998, the losing team has missed the next playoffs the next season at an elevated rate in recent years (nine years missed in the last 18 years). Well, the winning teams missed the playoffs only one less year (8 out of 18) since 1998. There is no difference in a teams playoff rate the next year when comparing the winning Super Bowl team to the losing Super Bowl team.

I went into this analysis with the goal of proving the theory that losing Super Bowl teams suffer from a hangover and perform poorly the following season as a result of experiencing failure in the biggest game on the biggest stage. But once we compare the losing teams’ data to the winning teams’ data, we don’t see a difference in their rate of success in making the playoffs the next season.
When combining the data for the winning and losing Super Bowl teams, they have a playoff rate of 71% the next year season. Should we expect the best two teams (arguably) from the previous season to miss the playoffs almost 30% of the time the next year when there are a total of 12 teams (38% of the league)* in the playoffs? Adding two more categories for comparison, playoff teams and non-playoff teams, might help us make a more informed opinion on Super Bowl teams’ playoff rate the next season. *currently 12 out of 32 teams make the playoffs, it hasn’t always been 38%, but has ranged from 38% to 43% since 1990. Changes are due to expansion increasing the total number of teams in the league from 28 to 32 over time.
The 29% playoff miss rate for Super Bowl teams seems high in isolation, but the rest of the playoff teams miss the playoffs the next year 47% of the time.
If your team is in the playoffs, enjoy the moment, because next years odds of returning are essentially a coin flip. For most playoff teams it would be hard to imagine that they won’t make it the next year, but one out of two teams will not. It’s even harder to imagine a scenario where a Super Bowl team doesn’t make the playoffs, but nearly one out of three will not make it the next year. Rounding out the list are the non-playoff teams which will see about a quarter of teams making it the next year and three-quarters continuing to miss out.
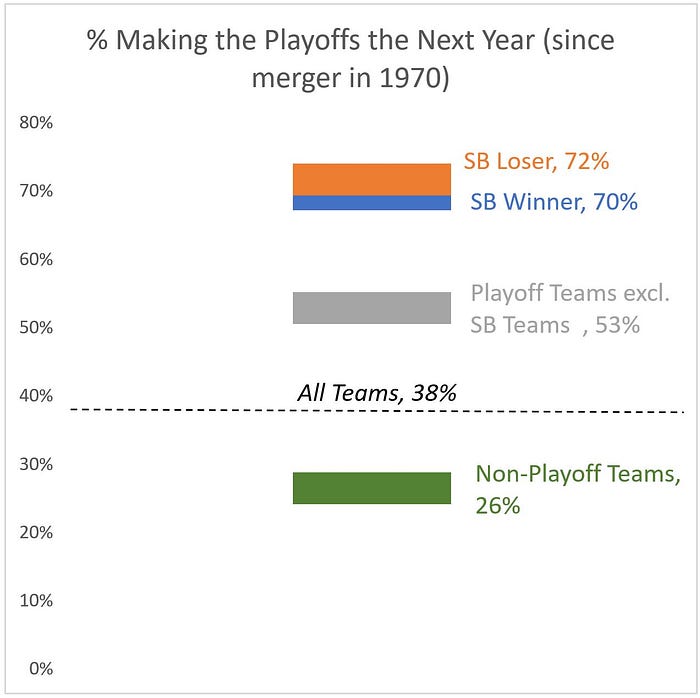
Comparing the Super Bowl teams to other playoff teams suggests that the 71% success rate of making the playoffs seems relatively good compared to 53% for the other playoff teams. The obvious flaw in this approach is that generally the two best teams are the Super Bowl teams, and they should have a better playoff rate the next season. So another approach is to compare Super Bowl teams to non-Super Bowl teams with a similar record. This will eliminate some of the weaker playoff teams from the analysis such as an 8–8 or 9–7 division winner (or even the occasional playoff team with a losing record, which has happened twice in the 16-game schedule era*). *excluding 1982 when the NFL implemented a 16-team playoff because of the strike-shortened season
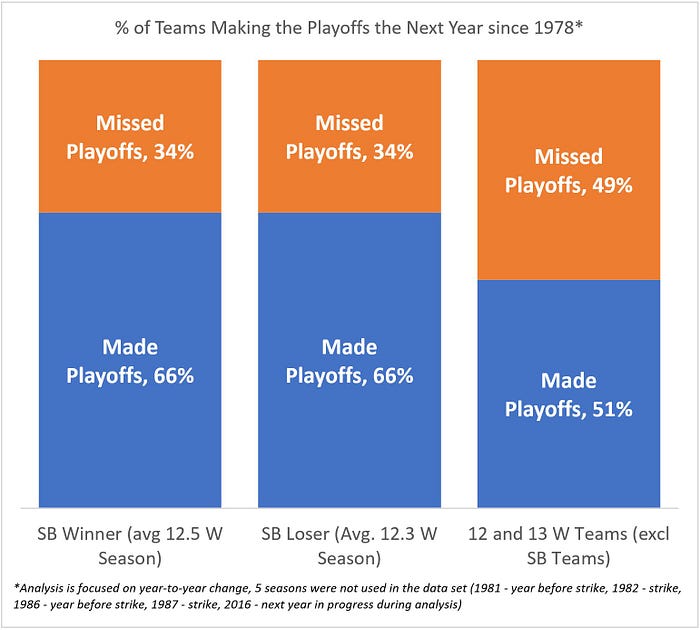
For this comparison, I am only using data back to 1978 when the NFL changed to a 16-game schedule. There was a strike in 1982 and 1987 and those years produced anomalous results, so I’m excluding those years as well as the year prior to strike years because I’m examining the previous year’s results vs. the next year’s success.
The average Super Bowl winning team won 12.5 regular season games, the losing team was similar with 12.3 wins. I will compare the playoff rate in the following year for the 70 Super Bowl teams to the 80 teams with 12–13 wins that were NOT in the Super Bowl during that same time period.
In the 16-game schedule era, Super Bowl teams made the playoffs two-thirds of the time. Coincidentally, both the winning and losing team have the same rate of 66%. By comparing this to all other 12 and 13-win teams excluding Super Bowl teams, Super Bowl teams are outperforming non-Super Bowl teams. 12 and 13-win teams who did not play in the Super Bowl miss the playoffs about half of the time the next season. This data (see below) suggests that Super Bowl teams missing the playoffs nearly a third of the time is better than what might be expected, given the fact that the other 12–13 win teams miss the playoffs half of the time.
As an interesting side note and a slight diversion from the purpose of this analysis, the Kansas City Chiefs were a notable oddity when I was looking at 12 and 13-win teams and their playoff rate the next year. Three out of the 15 teams that missed playoffs the season after going 13–3 were the Chiefs. In fact, since the switch to a 16-game schedule, 13 wins have been the Chiefs best regular season record and they are 0–3 in making the playoffs the year after winning 13 games. Perhaps this is because they were in a tough division, maybe it was bad injury luck, or likely it’s just a small sample size with randomness tempting us to search for a cause. I have listed a little bit of information about those three Chiefs teams in the notes section at the end of this article.
Making the playoffs isn’t always an indicator of how well a team played.
One of the key factors for a team to make the playoffs is the quality of the other teams, particularly teams in the same division. Although making the playoffs is what matters, we need to go beyond using playoff percent as the only key metric.
Since 1978 there have been 23 teams with ten or eleven wins that did not make the playoffs. 16% of ten-win teams do not make the playoffs and 2% of eleven-win teams do not make the playoffs.
The best teams to miss the playoffs are the 2008 Patriots who went 11–5 (Key players: QB Matt Cassel, RB Sammy Morris, WR Randy Moss, WR Wes Welker, DE Richard Seymour, NT Vince Wilfork) and the 1985 Denver Broncos who also went 11–5 (Key players: QB John Elway, RB Sammy Winder, WR Vance Johnson, WR Steve Watson, LB Karl Mecklenburg, DE Rulon Jones).
Conversely, there have been teams with relatively bad records making the playoffs.
15 teams with either seven or eight wins have made the playoffs since 1978 (Excluding the two strike seasons of 1982 and 1987). An eight-win team has a 9% chance to make the playoffs and a seven-win team has a 1.6% chance to make the playoffs.
The two teams with only seven wins to make the playoffs were the 2010 Seahawks (Key players: QB Matt Hasselbeck, RB Marshawn Lynch, RB Justin Forsett, DE Chris Clemons, S Earl Thomas) and the 2014 Panthers (Key players: QB Cam Newton, RB Jonathan Stewart, TE Greg Olsen, WR Kelvin Benjamin, DE Charles Johnson, LB Luke Kuechly, CB Josh Norman). Most people would agree that the 2008 Patriots with an 11–5 record were a better team than the 7–9 Seahawks in 2010, which is why focusing on playoff percentage should not be the only metric we look at in determining a teams success in the next season.
The next part of this analysis explores the percentage of teams that improve or decline in the regular season based on their record the previous season.
The chart below is a look at the change, categorized by the number of wins they had in the prior season. For example, a three-win team has improved 82% of the time, repeated their three-win season 6% of the time and have had a worse record 15% of the time. Because of movement towards the mean for reasons I stated at the beginning of this article, you would expect the worst teams to improve and the best teams decline. Interestingly, the data shows that 8–8 teams improve and decline at exactly the same rate of 43%, with another 14% remaining at 8–8 the next year.

This analysis was completed in the middle of the 2017 season, so the chart shows that 100% of 1–15 teams improve the next year. This is expected because it’s extremely hard to go 0–16 or to repeat a 1–15 season. Now that the 2017 season is over, the Cleveland Browns have become the first 1–15 team to NOT improve the next season. There have been 10 teams that have had a 1–15 record. Going from 1–15 to 0–16 is a historical first. Remarkably, the average 1–15 team is 7–9 the next season. The Miami Dolphins had a record 10 game improvement from 1–15 to 11–5 in 2007 and 2008. After the 2007 season, the Dolphins changed their head coach, GM, and probably more importantly, they went from a host of quarterbacks in ’07 led by Cleo Lemon with the most starts (7) to Comeback Player of the Year winner Chad Pennington in 2008. Before the 2008 season, the Dolphins had the #1 overall pick as 1–15 teams generally do. They selected T Jake Long who immediately anchored their offensive line. Jake Long made the Pro Bowl in his rookie year and the Dolphins improved from allowing 42 sacks in 2007 to allowing only 26 sacks in 2008.
So how does all of this relate back to the initial theme of this article? Is there a Super Bowl hangover? When using playoff rates as one indicator, I have suggested that Super Bowl teams are probably not missing playoffs at a higher rate than expected. Using the improve/decline analysis above, we can place Super Bowl teams on that same chart and determine if Super Bowl teams are an outlier in terms of the improve/decline metric. As I previously stated, the average Super Bowl winner has a 12.5 win season and the average Super Bowl losing team has a 12.3 win season. I have added these two groups (SB winners and SB losers) to the chart below. Looking at the data this way will demonstrate if these Super Bowl teams are outliers. The average Super Bowl losing teams’ record improves only 12% of the time and declines 76% of the time. If we only had this number without context, we would likely assume that there is a Super Bowl hangover. But with the benefit of having the rest of the data for comparison, it seems that the losing teams’ rate of decline is just about where it should be. Although Super Bowl winning teams only improve their record 18% of the time and decline 68% of the time, they’re probably doing better than they should be the next season given their average record in their Super Bowl year. Even though Super Bowl winning teams average 12.5 wins, their improve/decline percentage is more in line with an 11 or 12-win team.

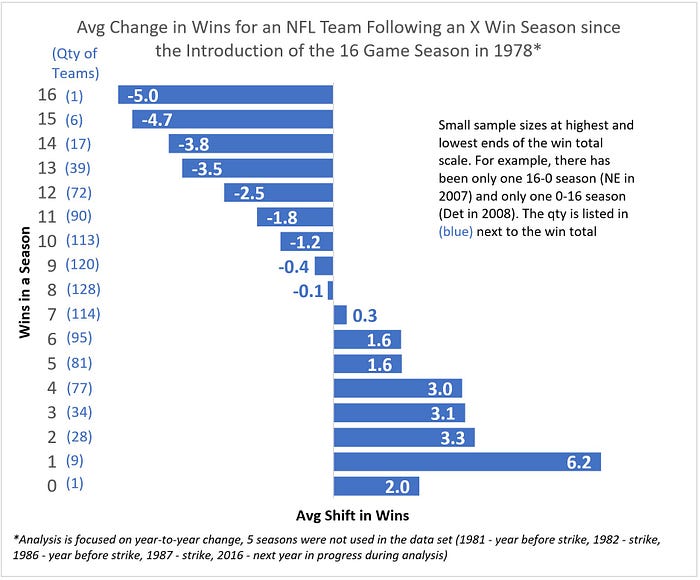
The final part of the analysis examines the average shift in wins the next season based on a team’s record in the prior season.
The general trend is similar to the improve/decline statistic above but is measured in terms of average win-shift instead of the percentage of teams to improve or decline. First, let’s look at the quantity of teams in each category. As you might expect, the bar chart representing the quantity of teams by the number of wins is a typical bell curve with the largest group going 8–8 (128 teams, 12.5% of the total), and the fewest number of teams at the far right and left. It’s important to be aware of the small sample sizes at the extreme ends of the bell curve as you look at the data.

When I decided to analyze the data, I anticipated the image below. In my experience, it’s not common that a hypothesis turns out to be accurate after objectively analyzing the data, but I was happy to see that in this case, my guess was right. The very best and very worst teams move toward the mean to the largest degree and the teams in the middle tend to stay in the middle. Again, there are a number of reasons for this, such as the draft, schedule strength, coaching changes, good/bad luck not repeating, etc. The Y-axis represents the number of wins in a season and the bars display the average shift in wins the next season. For example, an average 13–3 team (there have been 39 of them) will have 3.5 less wins the next season. So if you are a fan of the Patriots, Eagles, Vikings or Steelers, don’t be surprised if they end up with 9 or 10 wins in 2018…well, except for the Patriots, they tend to defy logic. And what about this year’s four-win teams? We shouldn’t be shocked, in fact, we should expect a three-win improvement from these teams. Like most four-win teams, they experienced bad luck, and bad (or good) luck is not likely to continue. Just by adding a healthy Andrew Luck and Deshaun Watson they are extremely likely to improve their record by multiple wins.
Like I did with the Improve/Decline charts, I have included the Super Bowl teams along the Y-axis in the chart below. They are placed between the 12 and 13 win groups based on their average win total to illustrate if their wins have shifted within an expected range. The losing Super Bowl team, represented by the red bar, has decreased by an average of 2.8 wins the next season. Based on a quick glance at the chart, that shift seems right about where you would expect it to be. I noted earlier that Super Bowl winners have a better than expected improve/decline rate. Looking at the win-shift data, they have also outperformed expectations by declining an average of only 2.0 wins. Visually, the Super Bowl winning teams’ shift seems to be an outlier. You might expect a shift that is closer to a 3.0 win decrease for Super Bowl winners based on their regular season record.

A slightly more scientific approach to validating that Super Bowl teams average win-shift is within an acceptable range is to show the expected record based on a linear regression. I performed a simple linear regression with data from every season since 1978 when the 16-game schedule era began (excluding strike seasons of ’82 and ’87, the seasons prior to strike seasons because we are unable to compare record shifts to the strike-shortened seasons, and 2016, because this analysis began before the 2017 season was over). I plotted the wins in the prior season against the positive or negative win-shift in the subsequent season. Expected wins in the next season based on this regression are in the table below. The expected win-shift for a Super Bowl losing team (in red) which averages 12.3 wins, would be -2.8, which is exactly what they have averaged. The expected win-shift for a Super Bowl winning team (in green) which averages 12.5 wins, would be -2.9. This indicates that Super Bowl winning teams’ average decline of 2.0 wins is better than expected.
Even though the average Super Bowl winning team’s record declines by 2.0 wins the next season, that is almost a full win better than their expected win-shift.

Conclusion
I sincerely believed the theory that Super Bowl teams have experienced a Super Bowl hangover, so I started to dig through the data to validate my assumption. The first part of my analysis, the time series chart in Section one, did confirm my hypothesis. I was pleased to find out that I was right. Except…maybe I wasn’t. Sure, I could have stopped there to confirm my hypothesis, but this initial level of analysis didn’t provide enough rigor. Super Bowl teams miss the playoffs 30% of the time. That seems bad, but what do other teams do? What about teams that aren’t in the Super Bowl and have a similar regular season record? Once this next step was added to the analysis, my assumption became a little less correct.
Then I noticed those 11–5 teams that missed the playoffs and also the seven and eight-win teams that have made the playoffs. This illuminated the fact that a teams ability to make the playoffs can be heavily influenced by the quality of the other teams in their division. Using playoff percentage as the only indicator will bring a significant amount of noise into the analysis.
Next, I analyzed the percentage of teams records that improve, decline or stay the same the next season based on their wins in the prior season. I added Super Bowl teams to the data for comparison. In the final section, I used a similar process but instead of the percentage of teams to improve or decline, I focused on the actual shift in wins. Both of these steps shifted me away from my initial assumption at the beginning.
The takeaway from this analysis is that we shouldn’t be shocked if a Super Bowl team does not even make the playoffs in the subsequent season. We should expect to see this occur every couple of years. Since the first Super Bowl in 1967, one of the two Super Bowl participants has missed the playoffs the next year 52% of the time — this is up to 72% of the time since 1998. These teams do not miss the playoffs because they are letting the success or the failure in the most important game impact their performance the next season. Taking everything into account, my analysis suggests that Super Bowl teams’ playoff rates and win-loss records in the subsequent season are normal or even better than they should be based on typical regression to the mean. There is no Super Bowl hangover.

Notes
Those three 13–3 Chiefs teams that missed the playoffs the year after winning 13 games were:
- The 1995–96 team led by head coach Marty Schottenheimer, Steve Bono (QB) and future Hall of Famers Marcus Allen (RB) and Derrick Thomas (OLB)
- The 1997–98 team was again coached by Schottenheimer. They transitioned from the RB tandem of Marcus Allen (in his last season) and Greg Hill in ’97 to Bam Morris and Donnell Bennett in ’98. Virtual Hall of Fame lock, Tight End Tony Gonzalez joined the team as a rookie in ’97. Elvis Grbac and Rich Gannon were starters at QB for significant portions of both seasons. Derrick Thomas was a part of those teams as well. Another notable name during those seasons was Andre Rison (WR).
- The last time the Chiefs went from 13–3 to missing the playoffs the next year was from 2003–04 when they were coached by Dick Vermeil. They had a great offense in both of those seasons ending up 1st or 2nd in points per game in those two years. The offense was led by Trent Green (QB) Priest Holmes (RB) and Tony Gonzalez. Their defense slipped in 2004 allowing 7 more points per game than they did in ‘03.
Pro Football Reference is a great site for historical stats. I used this site to research and gather season by season team records and for some of my references to past players/teams.
For all comparisons involving season to season shifts during the 16 game schedule era, the following years were excluded from the data: 1981 and 1982 — because 1982 was a strike-shortened season, and 1981 didn’t have a full subsequent season (1982) the next year for comparison of record changes. 1986 and 1987 for the same reason. 2017, because the 2018 season hasn’t started at the time of this analysis, therefore we have no next season for comparison.